Download and view report in PDF.
1. Introduction
Private-public risk sharing has been an important and unique feature of the federal crop insurance program since 1981. Under the Federal Crop Insurance Act of 1980, the Federal Crop Insurance Corporation was encouraged to privatize delivery functions to the maximum extent possible. Private sector involvement was seen as critical to ensuring a rapid expansion of the program. Today, the program is delivered entirely by private crop insurance companies and independent insurance agents.
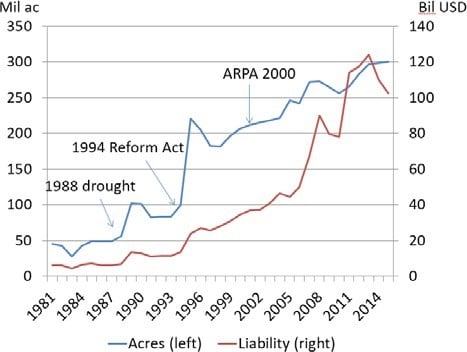
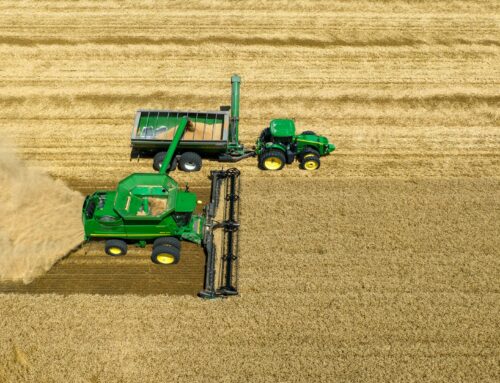
The growth of the crop insurance program, while slow in the initial years after passage of the 1980 Act, began to grow geometrically in the mid-1990s, aided by increased subsidies which encouraged producers to insure at higher coverage levels and by an expansion of crop coverage and a widening of product choice including revenue insurance (Glauber 2004, 2012). By 2015, area insured under the program totaled almost 300 million acres accounting for over 85 percent of potentially insurable area and total liability (coverage in force) topped $100 billion USD (figure 1).
Figure 1 — Growth in the US crop insurance program
Crop insurance is viewed by many farmers and members of Congress as a key piece of the federal farm safety net. Unlike many other farm programs, crop insurance largely escaped cuts in the 2014 farm bill. Indeed, the 2014 legislation augmented coverage options available to farmers, adding revenue insurance for peanuts and supplementary coverage options for most row crops, resulting in a projected
$5.7 billion increase in program costs (Congressional Research Service 2014).
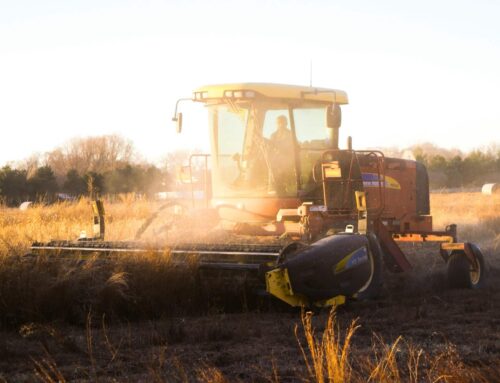
Crop insurance has not been without its critics however. The annual costs of the federal crop insurance program have grown significantly since 2000 (figure 2).
Figure 2 — Crop insurance program costs
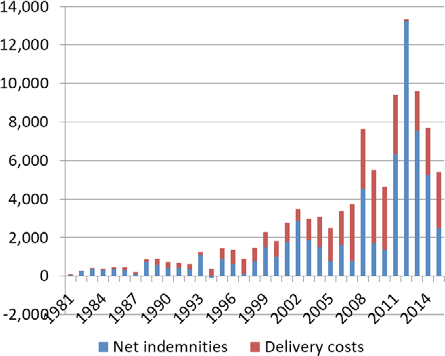
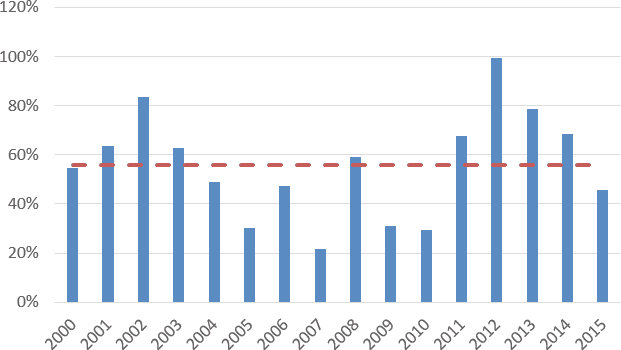
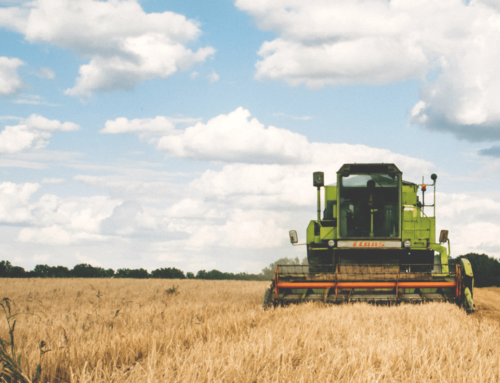
Estimated annual costs are projected at $8.9 billion over FY 2016-25 (Congressional Budget Office 2016) making it the largest single farm program in the farm safety net.1 Delivery costs for the crop insurance program, including expense reimbursements and net underwriting gains paid to the private company for delivery, are projected to exceed $2.6 billion annually. That means that for every $1 in total government outlays, about $0.71 goes to producers, with the rest going to the companies. Historically, that number has been even higher. Over the period 2000- 2015, companies received almost 45 cents out every dollar spent on federal crop insurance (figure 3).
Figure 3 — Percent of total insurance subsidies that goes to the producer
Critics point out that delivery costs have increased significantly over the past 15 years, particularly agent commissions (Babcock 2015). The crop insurance industry has defended those costs arguing that expenses have outstripped reimbursements and that profitability measures in the crop insurance industry lag comparable measures faced by other Property & Casualty (P&C) lines of insurance (NCIS 2015).
The regulatory structure outlining the economic relationship between the federal government and private insurance companies is laid out in the Standard Reinsurance Agreement (SRA), an annual contract that spells out the responsibilities of both parties.2
The SRA determines compensation for the companies through expense reimbursement and risk sharing provisions for crop insurance liabilities. Provisions of the SRA have not changed since the 2011 SRA was negotiated in 2010. Congress included provisions in the 2014 farm bill that specified that any changes in the SRA were to be budget neutral with respect to underwriting gains and administrative and operating costs (Congressional Research Service 2014).
This paper examines the so-called public- private partnership that underlies the delivery component of the federal crop insurance program.3 I begin first with a discussion of how delivery under the crop insurance program differs from fire insurance or other P&C lines of insurance. While the functions of each have many similarities, there are important differences that help explain the uniqueness of the crop insurance program. Those features are outlined in section 2. In section 3, I focus on Administrative and Operating (A&O) expenses facing the industry, how they have evolved over time and how they compare to other lines of insurance drawing on averages in the P&C industry. Here, I draw on, in part, analysis presented in industry- sponsored profitability studies (Grant Thornton 2014) as well as P&C industry averages (A.M. Best 2014).
A unique feature of the federal crop insurance program is that the government shares underwriting losses and gains with companies through the SRA. The degree of risk sharing between the government and companies has always been controversial, but since the early 1990s the companies have agreed to take on more risks and have enjoyed greater compensation for doing so.
As I will show in section 4, risk sharing and returns vary significantly by region, which has implications for a heterogeneous industry composed of larger companies who write policies in most states and a number of smaller, more regional-based companies.
One of the salient features of the federal crop insurance program is that unlike other private lines of insurance, companies cannot compete on price. In a competitive market, excess profits would typically be passed on to consumers (in the form of lower premiums). In a highly regulated market like that for crop insurance, competition occurs for elements like agent services which may adversely affect a firm’s profitability.
In section 5, I offer a number of options for changing the manner in which crop insurance is delivered. While all of the options aim to cut costs, they also attempt to introduce more market competition by further privatizing some functions of the crop insurance market (e.g., rate making). Conclusions are offered in section 6.
2. How the crop insurance industry differs from other Property & Casualty lines of insurance
The key differences between government-subsidized multi-peril crop insurance (MPCI) and other lines of P&C insurance are presented in table 1. The table is drawn from a recent industry report on profitability in the crop insurance industry (Grant Thornton 2014) and lays out the principal distinctions in functions of each.
Under private lines of insurance, the company sets premium rates. Typically those rates must be approved by state insurance commissions but importantly they are set individually by companies based on an assessment of underlying actuarial risks and market demand.
Premiums must be sufficient to cover administrative and operating expenses of the company so they include an expense load. Expenses vary by industry (next section). In the case of federal crop insurance, producers are charged premiums that reflect the underlying actuarial risks of crop production (and revenue). Those rates are either set by the Risk Management Agency or in the case of private products brought forward under Section 508(h) of the Federal Crop Insurance Act, approved by the Board of Directors of the Federal Crop Insurance Corporation.4
The same rates apply to all companies. That is, company A must offer a producer the same rate as offered by company B. There is no expense loading in the premium costs. The government provides separate reimbursements for administrative and operating expenses that are set by terms of the Standard Reinsurance Agreement.
Table 1 – MPCI vs. P&C Insurance Lines
| P&C Insurance | MPCI Program | |
|---|---|---|
| Premium | Expense loaded –administrative expenses are included in the premium charged. | Not expense loaded –administrative and overhead expenses are partially reimbursed to companies through A&O expense reimbursements. |
| Premium Rates | Set by company, approved by State regulators. Rates will differ by com- pany due to risk and administrative loads. | Set by RMA – the same rates apply to all companies. |
| Premium Payments | Paid upfront at time of sale. Held by company to generate investment income. | Paid at mid-season, with companies turning over funds to RMA within 30 days. Minimal to no investment income. Credit risk to company of nonpayment by policyholders. |
| Underwriting | Ability to underwrite risks. Can choose whether or not to accept risks and to modify rates and coverage to amend participant risk profile. | No ability to underwrite risks. Must take all eligible participants regardless of risk profile. |
| Reinsurance | Private | Government provided reinsurance; retained risks may be retro-ceded to private reinsurance market. |
| Administrative expenses | Set by company and approve by state regulators as part of the premium rate. | A&O expense reimbursement rate set by statute or contractually by FCIC. |
Under private insurance lines, premiums are typically collected at the time of signup (or in the case of continuous coverage like
homeowners insurance at regularly scheduled intervals throughout the year). Companies earn investment income from these funds that can contribute significantly to their annual revenue. Under crop insurance policies, producers are typically not required to pay premiums until after they report planted acreage (which is typically several months following sign up).
Companies then must turn over premiums to the Risk Management Agency within 30 days after receiving payments from producers. As a result there is little opportunity to earn interest on those funds. Like other commercial lines, crop insurers are responsible for premium collection and must absorb any losses from non-payment.
Underwriting is another area where crop insurance differs from other lines of insurance. Under the SRA, crop insurance companies are required to write all federal crop insurance lines in a State if they decide to operate in that State (Brichler 2007). They are not allowed to turn down customers or adjust rates based on normal insurance underwriting rules.
Thus, insurance companies who agree to participate in the federal crop insurance company agree to terms under the SRA that cede most ratemaking and underwriting activities to RMA, yet requires companies to share in underwriting risks. In return, companies are reimbursed for a portion of their expenses and, on average, earn net underwriting gains through the reinsurance agreement with the government that are positive. To those aspects I now turn.
3. Administrative and Operating Expense Reimbursements
In exchange for delivering crop insurance to producers, crop insurance companies are reimbursed for administrative and operating (A&O) expenses as well as sharing in underwriting gains and losses. In the first decade following passage of the Federal Crop Insurance Act of 1980, expense reimbursements were the primary source of income for crop insurance companies, as companies shouldered little of the
underlying underwriting risks. By the late 1980s, for example, companies received reimbursements equal to 33 percent of total premium costs (figure 4).
Figure 4 — A&O expense reimbursements paid to companies
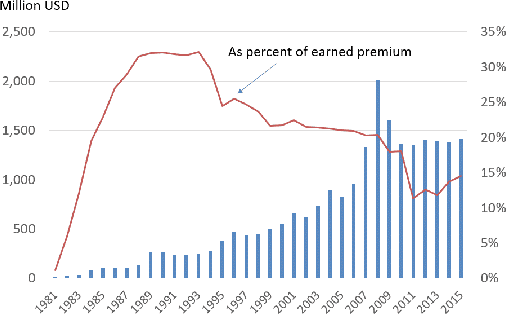
As risk sharing through the Standard Reinsurance Agreement increased in the early 1990s, expense reimbursement rates were reduced. Responding to criticisms by the U.S. Government Accountability Office and USDA Inspector General, Congress reduced the reimbursement rates over time, such that by 2010 the reimbursement rates for yield and revenue policies were equal to about 24 percent of premium costs.
Agricultural commodity prices began to rise significantly in 2005, which in turn increased premium costs. As premium levels more than doubled from 2005 to 2008, A&O expense reimbursements more than doubled as well. Critics had long charged that basing A&O costs on premium levels had little correlation with actual delivery costs (Arthur Anderson 1989; US Government Accountability Office 1997). To address the issue, the Risk Management Agency negotiated with the companies to insert a provision in the current SRA that effectively capped total A&O reimbursements at about $1.4 billion annually.5
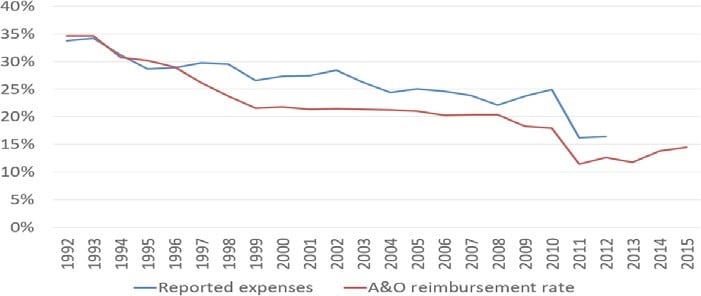
Actual expenses of the companies, as reported to RMA and published in a recent report on industry profitability (Grant Thornton 2014), have largely mirrored trends in A&O expense reimbursements, though reported expenses as a percent of earned premium have remained above reimbursement rates since the mid-1990s (figure 5). Companies have complained that the reimbursements do not fully compensate
for expenses (Burger 2005; Brichler 2007; Grant Thornton 2014). Oversight agencies like the US Government Accountability Office have argued that reported company expenses were much higher than the expenses that can be reasonably associated with the sale and service of federal crop insurance (US Government Accountability Office 1997, 2007, 2009).
Figure 5 — Reported expenses as percent of earned premium and A&O expense reimbursement rate
The largest single expense reported by the companies, and by far the most controversial, is compensation to crop insurance agents. Agent commissions averaged almost 60 percent of the total reported delivery expenses over 1992- 2012 (figure 6). By contrast, agent and broker commissions for P&C lines of insurance averaged about 30 percent of total expenses over the same period (Grant Thornton 2014). Agent commissions tend to be highest in states where net underwriting gains are largest suggesting that companies compete for business by “buying” independent insurance agents’ books of business by offering higher commission rates (US GAO 2009; Babcock 2012). In a recent paper, Smith, Glauber and Dismukes (2016) examined company expense data and found that as total payments to insurance companies increased between 2001 and 2009, an increasingly large share of the agricultural insurance industry’s rents accrued to insurance agents. Their econometric analysis suggested a significant and positive relationship between net underwriting gains and agent commissions.
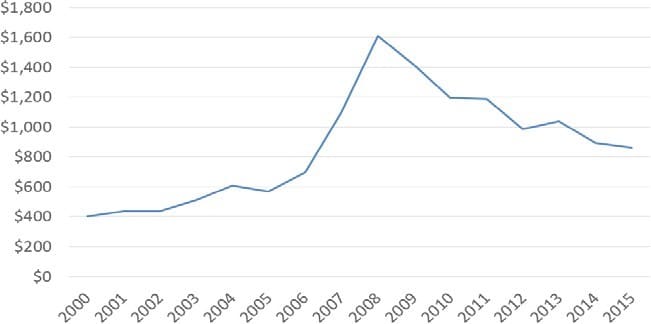
Babcock (2015) notes the large increase in agent commissions on a per policy basis. Between 2000 and 2008, for example, commissions per policy increased by over 20 percent annually, far outstripping general inflation rates and commodity price increases (figure 7). Over 2008 to 2015, commission rates per policy fell by about 46 percent, or about 8.5 percent annually. In part, that decline reflects lower crop prices and premium levels. In addition, the 2011 SRA introduced several provisions that affected commission rates. First, as mentioned above, overall A&O expense reimbursements were capped. Second, the 2011 SRA lowered net underwriting gains in key states where agent commissions had been among the highest.
More significantly, perhaps, the 2011 SRA imposed new requirements that agent commissions could not exceed 80 percent of the total A&O reimbursements within a state unless that state experienced positive underwriting gains. In the event of positive underwriting gains, total agent commissions could not exceed total A&O reimbursements. Agents have complained that the 2011 SRA provisions effectively impose wage controls on their services (Dalton 2010; McSherry 2012).
Figure 6 — Delivery expense by category, as percent of total delivery expense
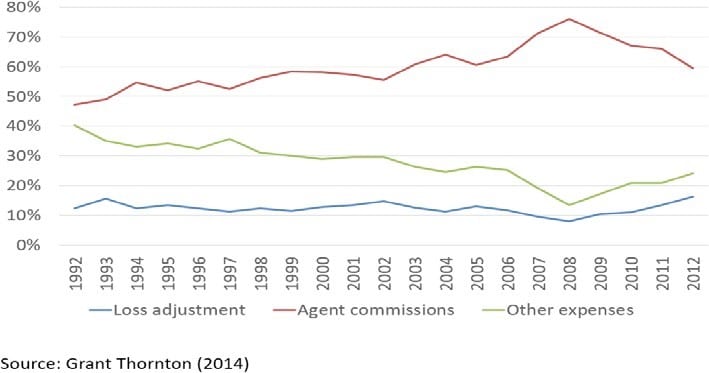
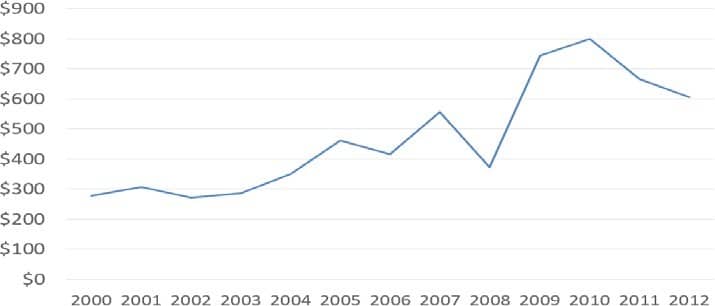
Other expenses such as loss adjustment have also increased over the past 15 years. One would expect that loss adjustment costs would vary somewhat with the underlying loss performance of the program. That is, one would expect higher costs when there are more losses to adjust. Figure 6 suggests that loss adjustment costs as a percent of total expenses are higher when crop insurance losses are high (eg, 1993, 2002, 2012). However, expressed on a per indemnified policy basis, reported loss adjustment costs increased by 12 percent
annually between 2000 and 2010 before falling 25 percent over the next two years (figure 8).
Are A&O expenses for crop insurance excessive? Reported delivery costs as a percent of total premium averaged over 27 percent from 1992 to 2010. Since 2011, delivery costs have fallen to about 16 percent of total premium costs. The crop insurance industry has pointed out that crop insurance A&O costs are far lower than comparable expenses in other P&C lines (Grant Thornton 2014). For example, total underwriting expenses incurred as a percent of premium earned for 2004–2013 were 35.9 percent for fire insurance, 39.9 percent for homeowners multiple peril, 30.4 percent for earthquake, and 37.4 percent for all automobile lines (A.M. Best 2014). That percentage is even higher when one nets out the expense load from premium costs. Underwriting expenses averaged about 60.6 percent of adjusted premium costs for all commercial P&C lines over 1992 to 2012 (Grant Thornton 2014).
But comparing crop insurance expenses to P&C expenses on the basis of premium costs is misleading because crop insurance premium rates are typically far higher than premium rates for other P&C lines.6 Thus, crop insurance delivery costs appear small in comparison to overall premium costs. Moreover, as will be demonstrated in the next section, the costs of delivery must include a discussion of the risk sharing aspects of the SRA since companies earn substantial income through net underwriting gains.
Figure 7 — Agent commission per buyup policy earning premium
4. Risk sharing through the Standard Reinsurance Agreement
A unique feature of the federal crop insurance program is that the government shares underwriting losses and gains with companies through the SRA. Risk sharing was seen as an inducement to encourage companies to participate in the program by allowing them to share in underwriting gains. By requiring companies to share in underwriting losses, reinsurance encourages companies to underwrite polices and adjust claims more carefully (Bohn and Hall 1999).
The degree of risk sharing has been a controversial aspect of the program from the outset. Under the SRA, if a private company chooses to write crop insurance policies in a state, it must offer crop insurance products to any farmer in that state. Moreover, insurance companies must accept the premium rates and underwriting guidelines established by the Risk Management Agency. Thus private crop insurance companies face a large potential risk exposure without recourse to raising rates to adequately cover costs of insuring high-risk individuals. As a consequence, companies were initially reluctant to share in much of the underwriting risks.
The degree of risk sharing between the companies and the FCIC changed significantly with the negotiation of the 1992 SRA. Under the 1992 SRA, companies were allowed to place policies in separate funds that offer varying degrees of retention and exposure. In return
for taking a larger share of gains, companies agreed to take on a larger share of exposure in the event of crop losses. The 1992 SRA introduced the basic structure of the agreement that exists currently. Subsequent renegotiations of the SRA have increased the exposure and potential gains to the companies.
The SRA currently combines both proportional and disproportional reinsurance features (Ker 2001; Vedenov et al. 2004, 2006). Under the current SRA, each company allocates crop insurance policies within a state to one of two reinsurance funds (the Commercial Fund and the Assigned Risk fund) depending on the relative riskiness of the policies.
Figure 8 — Loss adjustment costs per indemnified policy
The funds differ in the required level of retention and also in the shares of gains and losses from retained business under the disproportional features of the agreement. Under the Commercial Fund, companies can retain up to 100 percent of the premium and associated liabilities and share in a substantial portion of gains and losses on the retained business within that state. The current SRA establishes separate risk sharing provisions of the Commercial Fund for states based on their riskiness. State group 1 (Illinois, Indiana, Iowa, Minnesota, and Nebraska) includes states that have traditionally been the most profitable in terms of underwriting gains and companies writing in these states share in a larger share of gain and loss than in State groups 2 and 3. Under the Assigned Risk Fund, companies cede 80 percent of the premium to the government and share in a limited portion of the gains and losses on the retained business.7
Table 2 – Loss ratio by reinsurance fund
| Reinsurance Year | Assigned Risk | Reinsurance Fund Developmental | Commericial |
|---|---|---|---|
| 1992 | 1.60 | 1.29 | 1.01 |
| 1993 | 1.82 | 1.85 | 2.63 |
| 1994 | 0.84 | 0.62 | 0.39 |
| 1995 | 1.38 | 1.18 | 0.93 |
| 1996 | 1.14 | 1.06 | 0.66 |
| 1997 | 0.81 | 0.66 | 0.46 |
| 1998 | 1.48 | 1.23 | 0.74 |
| 1999 | 1.68 | 1.21 | 0.76 |
| 2000 | 1.55 | 1.08 | 0.75 |
| 2001 | 1.53 | 1.16 | 0.75 |
| 2002 | 1.85 | 1.57 | 1.17 |
| 2003 | 1.22 | 1.12 | 0.79 |
| 2004 | 1.11 | 0.86 | 0.64 |
| 2005 | 0.78 | 0.73 | 0.51 |
| 2006 | 1.22 | 0.68 | 0.61 |
| 2007 | 0.70 | 0.53 | 0.47 |
| 2008 | 1.05 | 0.95 | 0.83 |
| 2009 | 0.99 | 0.66 | 0.44 |
| 2010 | 0.81 | 0.55 | 0.50 |
| 2011 | 1.52 | — | 0.77 |
| 2012 | 1.28 | — | 1.64 |
| 2013 | 1.34 | — | 0.95 |
| 2014 | 1.18 | — | 0.83 |
| 2015 | 0.88 | — | 0.58 |
Table 3 – Net Underwriting Gains under the Standard Reinsurance Agreement, 1992-2015
| Reinsurance year | Gross Premium | Retained Premium by Companies | As percent of gross premium | Net underwriting gain | As percent of retained premium |
|---|---|---|---|---|---|
| 1992 | 694 | 466 | 67.1% | 23 | 4.9% |
| 1993 | 702 | 435 | 62.0% | -83 | -19.1% |
| 1994 | 919 | 536 | 58.3% | 104 | 19.4% |
| 1995 | 1,270 | 768 | 60.5% | 131 | 17.1% |
| 1996 | 1,627 | 1,156 | 71.1% | 246 | 21.3% |
| 1997 | 1,688 | 1,262 | 74.8% | 353 | 28.0% |
| 1998 | 1,876 | 1,592 | 84.8% | 279 | 17.5% |
| 1999 | 2,312 | 1,837 | 79.4% | 272 | 14.8% |
| 2000 | 2,537 | 1,894 | 74.7% | 282 | 14.9% |
| 2001 | 2,978 | 2,373 | 79.7% | 346 | 14.6% |
| 2002 | 2,909 | 2,294 | 78.9% | -48 | -2.1% |
| 2003 | 3,434 | 2,606 | 75.9% | 377 | 14.5% |
| 2004 | 4,168 | 3,140 | 75.0% | 691 | 22.0% |
| 2005 | 3,945 | 2,891 | 73.3% | 915 | 31.6% |
| 2006 | 4,709 | 3,500 | 74.3% | 822 | 23.5% |
| 2007 | 6,547 | 4,898 | 74.8% | 1,572 | 32.1% |
| 2008 | 9,833 | 7,696 | 78.3% | 1,094 | 14.2% |
| 2009 | 8,950 | 6,831 | 76.3% | 2,298 | 33.6% |
| 2010 | 7,595 | 6,063 | 79.8% | 1,914 | 31.6% |
| 2011 | 11,970 | 9,539 | 79.7% | 1,662 | 17.4% |
| 2012 | 11,121 | 8,642 | 77.7% | -1,319 | -15.3% |
| 2013 | 11,800 | 9,227 | 78.2% | 629 | 6.8% |
| 2014 | 10,076 | 7,897 | 78.4% | 1,018 | 12.9% |
| 2015 | 9,445 | 7,423 | 78.6% | 1,836 | 24.7% |
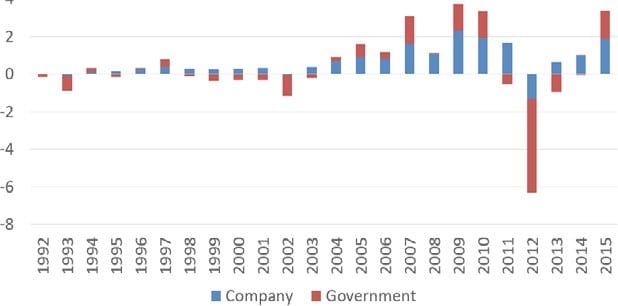
Figure 9 shows the share of underwriting gains and losses absorbed by the Government and private companies. For example, in 2009, total premiums collected (including premium subsidies) exceeded total indemnities paid by $3.7 billion. Of this underwriting gain, companies received $2.3 billion while $1.4 billion returned to taxpayers. In 2012, underwriting losses totaled $6.3 billion, of which $1.3 billion was absorbed by companies and $5 billion was absorbed by taxpayers.
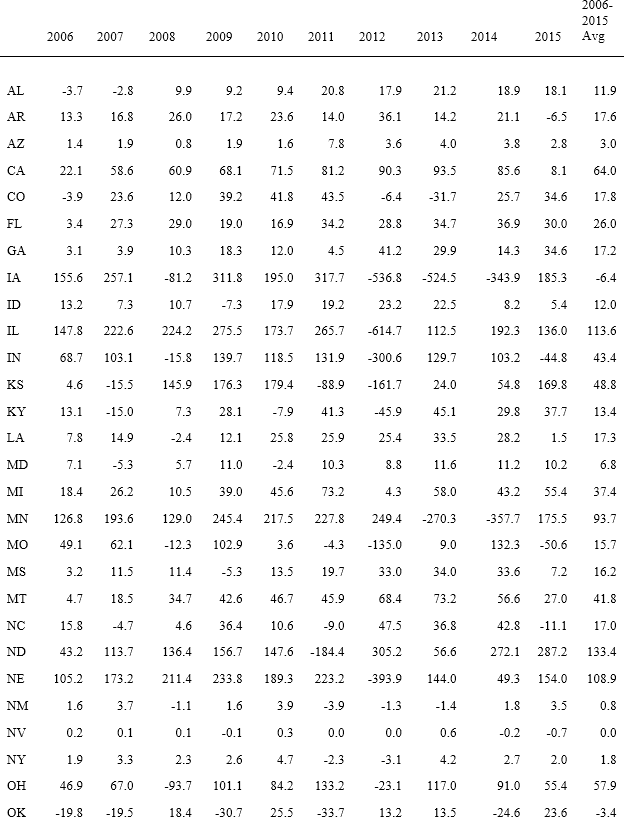
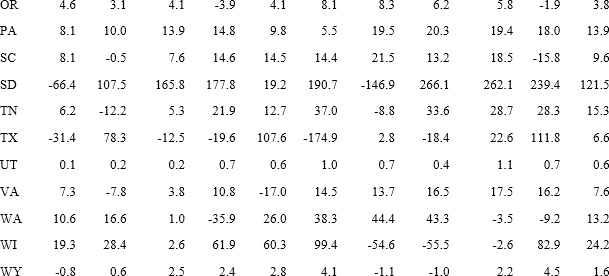
As retained risk and exposure have increased, so too, have net underwriting gains to the companies. Net underwriting gains totaled $3.9 billion from 1992 to 2005 and $11.5 billion from 2006 to 2015. The majority of net underwriting gains have been concentrated in the Midwest and California, where loss performance has generally been favorable (table 4). However, returns can be quite variable. For example, companies writing crop insurance in Iowa over 2005-2011 earned almost $1.2 billion in net underwriting gains. Over 2012-15, however, poor yields and falling prices resulted in net underwriting losses for companies of $1.2 billion in that state.9
Not surprisingly, the prospect of large underwriting gains has attracted insurance companies and all of the seventeen crop insurance providers currently write some portion of their book in at least one and often several of the top 10 states in net underwriting gains. Here again it is important to understand the difference between crop insurance companies and other P&C lines. For most private P&C lines, net underwriting income is often negative, but is offset by income and capital gains from investing earned premiums (A.M. Best 2014; Grant Thornton 2014).10 For the crop insurance industry, A&O reimbursements are intended to offset delivery expenses, and the program compensates insurers by providing a positive expected rate of return through the risk-sharing provisions of the SRA.
Figure 9 — Share of underwriting losses and gains absorbed by companies and the Government
Whether that compensation is adequate is a topic that has been hotly debated by the companies and the Risk Management Agency. Basing returns on a net equity basis, RMA has argued that returns to the crop insurance industry exceed that of the P&C industry (Milliman Inc. 2009). The crop insurance industry position has been that returns should be based on a net earned premium basis which would indicate that crop industry returns are below that of the P&C industry (Grant Thornton 2014).11
Rather than debate the merits of each side’s arguments, it is instructive to examine the implications of excessive (or inadequate) profits in a less regulated insurance market. In those markets, companies would set premium rates to reflect costs and an underlying rate of return. If their premiums were too high, they would presumably lose business to lower cost providers. Excessive profits would not exist for long before they were bid away by companies offering consumers lower premium costs.
Table 4 – Share of underwriting gains and losses absorbed by companies
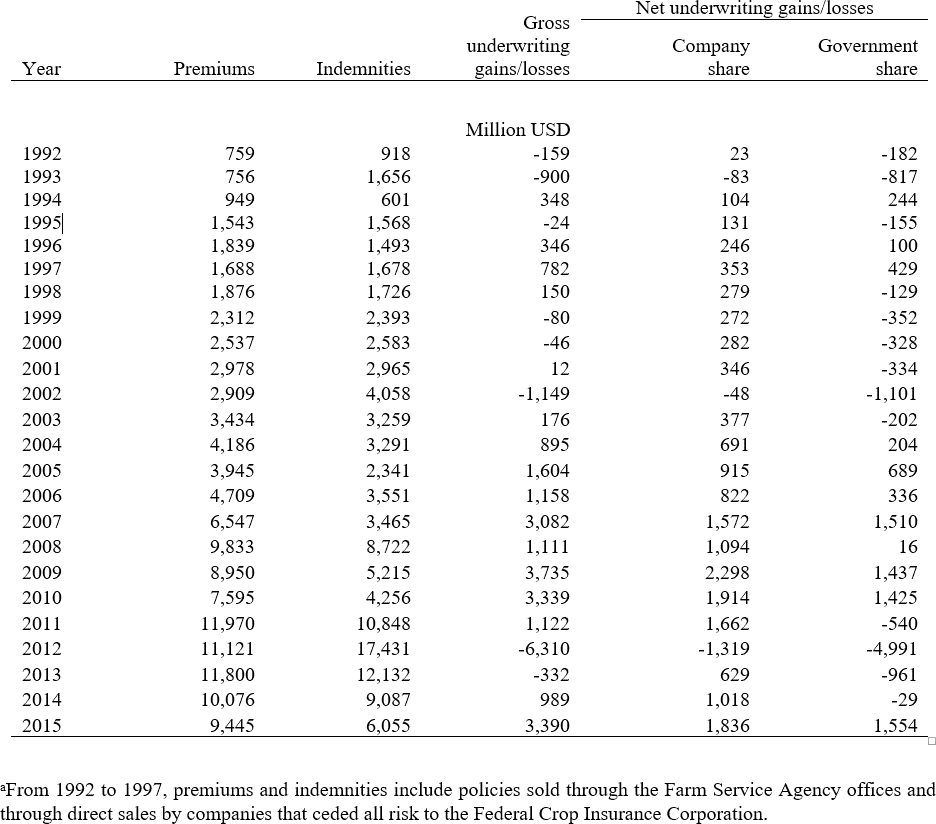
Table 5 – Net underwriting gains for selected States, 2006-15
Related Posts


Most Read
 Podcast
BWAF Podcast — Ep. 65: FY '25 Budget Request
Mar 21, 2024
Why Can't the Pentagon Pass An Audit?
May 18, 2000 |3 min read Weekly Wastebasket
U.S. Contributions to NATO Budgets
Mar 18, 2022 |7 min read


Get Social