Federal crop insurance is a highly taxpayer subsidized program that allows agricultural producers to shift much of their business risk onto taxpayers. Originally designed as a way to help producers recover from natural disasters, it has since morphed into an income guarantee program for the most profitable farm businesses. Primarily benefitting growers of only four crops (corn, soybeans, wheat, and cotton), crop insurance is now the most expensive taxpayer support for agriculture, outstripping all other agri¬culture safety net programs. It is a shining example of a government program filled with costly inefficiencies that detract from its goals and produce unintended consequences.
History of the Program
First created in 1938 as a response to the Great Depression, Federal crop insurance was designed to help protect agricultural producers recover from catastrophic losses like widespread droughts and floods. The Federal Crop Insurance Corporation was created alongside other farm subsidies and programs that aimed to increase crop prices and prevent soil losses from the Dust Bowl. Since then, Federal crop insurance has gone through major legislative and administrative changes that have disproportionately shifted the costs of managing agricultural risks onto the backs of taxpayers.
Crop insurance, a permanently authorized program, has been altered by both pieces of stand-alone legislation and by omnibus Federal farm bills which are normally passed every five or six years. Participation rates were low until 1980 when lawmakers passed the Federal Crop Insurance Act which expanded the program to cover many more crops and provided farmers with subsidies to purchase policies. In an effort to further increase participation, Congress passed legislation in 1994 that mandated farmers purchase crop insurance coverage in exchange for agriculture subsidy payments (although this was lifted in 1996). In 2000, Congress passed the Agriculture Risk Protection Act (ARPA) which increased premium subsidy rates to their current high levels. Finally, crop insurance was most recently altered in the 2014 farm bill when Congress responded to the Obama Administration’s finding $6 billion in administrative efficiencies by prohibiting future administrations from realizing any taxpayer savings by renegotiating the subsidies paid to private crop insurance companies.
Taxpayers Pick Up Greater Portion of Farmers’ Premiums
Federal crop insurance is significantly different than the home, car, health, or even private crop insurance policies that are familiar to most people. Instead of individuals or companies covering the full cost of their insur¬ance protection, taxpayers pick up more than half of the cost of producers’ crop insurance premiums. From 1980 to today, premium subsidies doubled from covering approximately 30 percent of a policy’s cost to an average of 62 percent; hence, producers are only paying 38 cents for every dollar of their insurance coverage. In 1994, Congress began offering free (to producers, not taxpayers) catastrophic coverage which kicks in for yield losses of 50 percent or more, bringing the total number of insured acres from 100 million in the early 1990s to 180 million in 1998. In 2000, the government began providing subsidies for not only yield-based policies (which cover crop losses) but also more expensive revenue-based (price times crop yield) policies that allow payouts to kick in even after a bountiful harvest. The program now covers over 120 different crops ranging from corn to clams on 296 million acres. Table 1 shows the drastic increase in subsidies from 1980.
| Table 1: Premium Subsidies for Different Levels of Insurance Protection | |||
| Policy Covers __% of Expected Yield Harvested | 1980 | 1994 | 2000 |
| Less than 50 percent | – | 100% | 100% |
| 50 percent | 30% | 55% | 67% |
| 55 percent | – | 46% | 64% |
| 60 percent | – | 38% | 64% |
| 65 percent | 30% | 42% | 59% |
| 70 percent | – | 32% | 59% |
| 75 percent | 17% | 24% | 55% |
| 80 percent | – | 17% | 48% |
| 85 percent | – | 13% | 38% |
| References: CATO, Jerry Skees, and the Congressional Research Service | |||
Subsidies are even higher (up to 80 percent) for enterprise and whole farm insurance units, meaning that when producers lump fields together for insurance purposes, the total cost of farmer-paid premiums is lowered. An “insurance unit” is simply a parcel of land that is insured separately from another parcel of land. Enterprise units combine all acres of a single crop into one unit, while whole farm units combine all crops into one. The government assumes that summing up crop losses across several fields will result in lower insurance payouts than evaluating each field’s final production totals individually, because a loss in one field could be offset by a bumper crop in another. The U.S. Department of Agriculture (USDA) also allows marginal land—portions of fields that are steep/highly erodible or subject to frequent flooding—
to be insured in separate units. Odds of harvesting a successful crop on these types of land are slim, so taxpayers pick up not only the direct costs of higher subsidies on multiple parcels but also the indirect risks and downstream costs of water pollution, soil erosion, loss of wetlands, and other unintended consequences.
Total Cost Quadrupled over Past Decade
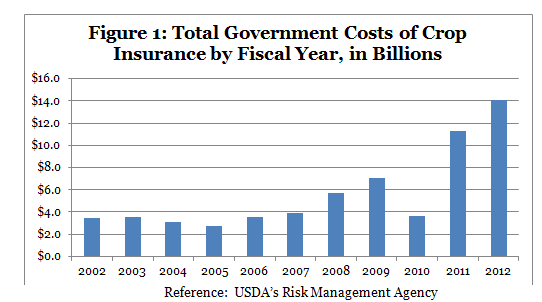
The total cost of crop insurance has ballooned over time as subsidy and participation rates increased, producers were able to guarantee revenue with taxpayer dollars, and subsidies tied to high commodity prices skyrocketed. Before the 1994 act, crop insurance cost taxpayers about $700 million annually. By Fiscal Year 2003, the program cost rose to $3.6 billion. Most recently, USDA estimated that after tallying losses from the 2012 historic drought, the total cost quadrupled to over $14 billion. See Figure 1 for more information.
Total taxpayer costs can be broken into three primary categories. Costs for FY2012 include the following (which are explained below):
- Premium subsidies (portion of insurance premiums paid by taxpayers): $7.2 billion
- Underwriting losses or gains: $5.4 billion loss (more info in final section)
- Administrative and operating expenses: $1.4 billion (more info in final section)
Total Costs are Routinely Underestimated
The cost of crop insurance has been severely underestimated over time. After the 2008 farm bill was passed, the Congressional Budget Office (CBO) projected that crop insurance would cost taxpayers $47 billion over ten years, but the actual cost will likely be at least $74 billion, an increase of 57 percent (including actual costs from FY2008-12 and projected costs from FY2013-17). Congress is planning to spend even more over the next decade – nearly twice as much from what was predicted just five years ago. See Table 2 for more information.
| Table 2: CBO Estimated and Actual Costs of Crop Insurance in Farm Bills | |||
| Farm Bill | Descriptions of Crop Insurance Costs | 10-Yr Cost, in Billions | Percent Increase |
| 2008 | Projected Cost after Passage of 2008 Farm Bill (FY08-17) | $47.2 | |
| 2008 | Actual Cost (Actual Costs from FY08-12 & Projected Costs from FY13-17) | $73.8 | 57% increase from projected |
| 2014 | Projected Cost of 2014 Farm Bill (FY14-23) | $89.8 | 90% increase from projected cost of 2008 bill |
| References: Congressional Budget Office and USDA’s Risk Management Agency | |||
Farm Businesses Receive Special Treatment
Despite some producers’ claims that crop insurance is too expensive to purchase, taxpayers pick up a majority of costs, and producers actually get more money out of the program than they pay in. From FY2002 to FY2012, farmer-paid premiums grew from $1.2 billion to $6 billion, but total indemnities (payments made after yield or revenue “losses” occur) increased twice as fast, meaning farmers got more than $2 back for every $1 paid into the system (see Table 3). In FY2012, record losses from drought and flooding caused farmers to receive $18.4 billion in indemnity payouts for just $6 billion paid in premiums, a good deal for farm businesses but not for taxpayers. In only one year since 2002 have farmers paid in more than they got back, a luxury not enjoyed by purchasers of any other type of insurance.
| Table 3: Crop Insurance Good Deal for Producers, Not Taxpayers | ||||||||||||
| Fiscal Year | '02 | '03 | '04 | '05 | '06 | '07 | '08 | '09 | '10 | '11 | '12 | Ave. |
| Farmers received $_ back for every $1 paid into crop insurance | $3.4 | $2.8 | $1.7 | $1.7 | $1.9 | $1.3 | $1.3 | $2.3 | $0.9 | $3.2 | $4.3 | $2.3 |
| Reference: USDA’s Risk Management Agency | ||||||||||||
Crop Insurance Companies Reap Billions
Farm businesses are not the only beneficiaries of the highly subsidized crop insurance program. Companies like Rain and Hail and Wells Fargo receive subsidies to sell and service taxpayer-subsidized crop insurance policies (called administrative and operating expenses), in addition to receiving dollars left over after all indemnity payments are made during favorable growing years (called underwriting gains). The companies carry little actual risk but are still paid handsomely by Uncle Sam who bears the burden of losses. Every five years, the USDA has the opportunity to renegotiate these subsidies in a new Standard Reinsurance Agreement (SRA).
In 2006, USDA attempted to reduce A&O subsidies by just $75 million but gave up after farm-state lawmakers – Senators Roberts (R-KS), Grassley (R-IA), and Conrad (D-ND) – objected. In the 2010 SRA, subsidies for A&O expenses were limited to $1.3 billion annually, resulting in companies and their profitable insurance agents receiving $1,200 every time a policy is written – about three times the actual cost as estimated by the industry itself. Companies railed against this slim cut of $600 million per year, wrongly claiming the changes would handicap the industry even though it continues to turn a hefty profit. In fact, since the renegotiation of the SRA, the number of crop insurance companies participating in the subsidized crop insurance program has increased from 16 to 19.
In addition to subsidies for administering the program, crop insurance companies receive a share of underwriting gains (or losses) each year. Underwriting gains are the premium dollars left over after all indemnities are paid while underwriting losses are instead realized when indemnities exceed premiums (usually after widespread natural disasters). From 2000 to 2008, insurance companies experienced an underwriting loss in only one year while benefiting from large gains in other years, like a $1.7 billion surplus in 2007. On average, companies retain about two-thirds of all gains while taxpayers pick up greater losses in poor growing years.
Over time, A&O subsidies and underwriting gains have grown to equal billions of dollars for the crop insurance industry. Before 1994, the industry never received more than $400 million from these two expenditures, but in 2012, it enjoyed at least three times this much. From 2005 to 2008, private companies received nearly $10 billion, an amount the Government Accountability Office (GAO) labeled “a kind of windfall.” In spite of this finding, the 2014 farm bill contains a provision that requires any future SRA renegotiation to be “budget neutral” and if any savings is obtained, the money must be plowed back into the subsidies provided to the private crop insurance companies.
Conclusion
The Federal crop insurance program has grown exponentially from its inception during the Great Depression. As the most expensive taxpayer support for agriculture, Congress must reevaluate crop insurance’s effectiveness in a time of record deficits and national debt. Simple, common sense steps such as reducing premium subsidies and eliminating administrative and operating subsidies and/or underwriting gains paid to crop insurance companies can save taxpayers billions of dollars while making crop insurance a more efficient and cost-effective aspect of the agriculture safety net.
For more information, visit www.taxpayer.net, or contact Joshua Sewell, josh at taxpayer.net.