View/Download this article in PDF format.
The federal government supports various conservation initiatives, but some of the largest voluntary and private land conservation programs in the country are found in the federal farm bill. Agricultural conservation programs were first introduced in the 1930s to reduce massive soil losses during the Great Depression. Since then, they have focused on preventing and mitigating unintended consequences and downstream costs of agricultural pollution. Agricultural conservation programs, particularly those introduced in the 1985 farm bill, have provided taxpayers with a positive return on investment.
The farm bill, typically renewed once every five to six years, contains several conservation initiatives in addition to a wide range of other supports, like nutrition assistance, farm commodity supports, and rural development initiatives. Farm bill conservation provisions are divided into two primary categories:
Programs that pay producers to implement short- or long-term conservation practices:
- The 2014 farm bill consolidated conservation programs from the current 23 down to 13 by moving smaller programs under new larger program umbrellas.
- Programs that either fund education and technical assistance initiatives or directly pay farmers to implement short- or long-term conservation practices.
Minimum conservation practices that producers must implement in exchange for farm subsidies:
- Conservation accountability standards are required to receive farm commodity and crop insurance subsidies, per the 2014 farm bill.
All of these provisions are implemented and administered by the U.S. Department of Agriculture’s (USDA) Farm Service Agency (FSA) or Natural Resources Conservation Service (NRCS). Together, they have helped improve soil and water quality, reduce the cost of fertilizer purchases, limit flood risks, improve drinking water sources, enhance wildlife habitat, and preserve land for future generations. But as with most government programs, improvements can be made to ensure that taxpayer dollars are spent in the most efficient and effective way.
Conservation Programs
Conservation programs that pay farmers either a one-time sum or annual payments are generally separated into three primary categories – working lands, set-aside, or regional programs.
Working Lands Programs
- Pays producers to implement conservation practices on acres currently in production.
- The largest working lands programs are the Environmental Quality Incentives Program (EQIP) and Conservation Stewardship Program (CSP), introduced in 1996 and 2002, respectively.
- EQIP: about 60 percent of its funding is reserved for cleanup of livestock and poultry waste while the rest funds practices like planting cover crops to limit soil erosion.
- CSP: pays producers to implement existing or new practices like rotational grazing, reduced tillage, more efficient fertilizer applications, and transitioning to organic agriculture.
Set-aside Programs
- Offer payments to retire land or wetlands from annual production.
- Introduced in the 1985 farm bill, the largest set-aside program is the Conservation Reserve Program (CRP) while smaller set-aside programs include the Wetlands and Grasslands Reserve Program (WRP and GRP, respectively). In the 2014 farm bill, WRP and GRP were consolidated into the larger Agricultural Conservation Easement Program (ACEP) but continue to maintain their previous functions.
- CRP: provides annual payments on ten- or 15-year contracts to install stream buffers, build terraces, and plant trees and/or grass on land historically in agricultural production.
- WRP: pays landowners to conserve wetlands.
- GRP: pays landowners to conserve grasslands.
Regional Programs
- Targeted initiatives historically focused on the Mississippi River Basin (MRBI), Chesapeake Bay, Great Lakes, and other watersheds which prioritize taxpayer dollars toward specific regions. These programs were consolidated into the new Regional Conservation Partnership Initiative in the 2014 farm bill. Funding is tailored for and responsive to on-the-ground, local, and real-world needs which provides taxpayers a bigger bang-for-their-buck.
According to the Congressional Budget Office (CBO), taxpayers spent $4.7 billion on conservation programs in FY2011 and will likely spend $58 billion over the next decade (which represents 6 percent of total farm bill spending). The costliest programs include CRP, EQIP, and CSP. With a greater emphasis on keeping land in production to capitalize on high crop prices, the cost of working lands programs has recently surpassed the cost of set-asides like CRP.
Meeting Conservation Accountability Standards in Exchange for Taxpayer Subsidies
In addition to programs that pay producers to implement conservation practices, certain agricultural producers are also expected to meet a set of minimum conservation standards in exchange for generous farm subsidies. The premise of these accountability standards—“conservation compliance”–is that receipt of federal funding is a two-way street and subsidies should not be used to tear up sensitive land, drain wetlands, and shift costs onto others. Farm bill provisions passed in 1985 state that if producers expect to receive annual farm subsidies, and as of February 2014 with passage of the 2014 farm bill crop insurance premium subsidies, they must also:
- Put a conservation plan in place to minimize soil erosion on highly erodible land (HEL),
- Refrain from tearing up sensitive land that has not previously been cultivated (known as Sodbuster), and
- Forgo draining wetlands (known as Swampbuster).
USDA reports that about 100 million acres of cropland are highly erodible and approximately 13 million acres of wetlands are adjacent to agricultural production, so about one-fourth of U.S. cropland is subject to these requirements. While the implementation and enforcement of these minimum conservation practices has varied from one area to another, studies highlight the positive return on investment for taxpayers. These best management practices have helped reduce the cost of agricultural pollution and reduce costs of future liabilities. Unlike traditional conservation programs, the cost of enforcing the standards is small since state and local USDA employees already staff offices throughout the country, but more should be done to ensure that accountability provisions are properly implemented, monitored, and enforced.
Impacts and Costs of Agricultural Pollution
Agricultural production, especially the fencerow-to-fencerow planting that is taking place in many parts of the Midwest, results in numerous unintended consequences and downstream costs:
- Soil erosion pulls dirt and excess manure or commercial nitrogen fertilizers into waterways, resulting in water pollution that affects downstream users;
- Installation of underground tiling forces water, nitrogen, and chemical runoff into underground pipes, polluting nearby waterways faster than would otherwise occur;
- Biofuels subsidies and mandates prompt farmers to limit annual crop rotations, increase corn and soybean production, and increase nitrogen applications.
The results have been staggering. More than half of U.S. streams have medium to high levels of nitrogen and phosphorus, and drinking water violations due to high nitrate concentrations have doubled over the past decade. The U.S. Geological Survey (USGS) found that nitrates exceeded average levels in 64 percent of shallow wells in both rural and urban areas. Excessive nitrogen and phosphorus from agricultural production in the Mississippi River Basin has led to the largest hypoxic “dead zone” in the world. Nitrogen flowing into the Gulf of Mexico spurs excessive algal blooms, cutting vital oxygen sources to aquatic life.
Agricultural runoff costs taxpayers and consumers billions of dollars annually but many of these can be prevented or mitigated with conservation programs and use of best management practices. Some of the costs include lower fishing revenue, increased health risks, higher costs of water treatment, and fewer recreational opportunities like hunting and fishing. The $650 million commercial fishing industry has experienced losses of up to 25 percent as a direct result of the hypoxic zone. Health costs also increase as water tainted with nitrates and phosphorus contribute to certain types of cancers, blood diseases, and intestinal illnesses. Farmers have an incentive to minimize fertilizer applications since synthetic fertilizers are one of the most expensive costs of agricultural production. However, with record profits in recent years, producers have put conservation on the backburner as they attempt to squeeze dollars from each acre, partially funded by taxpayer subsidies for federal crop insurance and other entitlements.
Drinking water is so tainted from nitrate pollution that some cities, towns, and even farmers are forced to buy bottled water, dig new wells, purchase expensive water treatment equipment, and install pipes to transfer water between municipalities. Some specific costs include the following:
- In 2009, researchers found that consumers spent over $800 million annually on bottled water due to various pollution and odor-related problems.
- USDA’s Economic Research Service found that “reducing nitrate concentrations in source waters by one percent would reduce water treatment costs in the U.S. by over $120 million per year.”
- Drilling new domestic wells on individual farms can cost up to $15,000 per location. According to USDA, removing nitrates alone costs utilities and individuals over $4.8 billion per year; one-third of this cost is directly attributed to agriculture.
- One new water system in northeast Nebraska will cost taxpayers at least $2.4 million to provide nitrate-free water to three small towns. With a combined population of only 208 people, the system will cost taxpayers a whopping $11,500 per person. If the funds were instead spent on preventing agricultural pollution, about 44,000 acres of sensitive land could have been taken out of production or 133,000 acres could have implemented better conservation practices, like installing grassed buffers to catch chemicals and fertilizer before entering the water supply.
Return on Investment
Simple conservation practices taken by farmers can provide taxpayers with a positive return on investment. USDA reports that minimum conservation standards and voluntary programs have significantly reduced soil erosion, protected wetlands, and enhanced water quality.
Soil Erosion Benefits
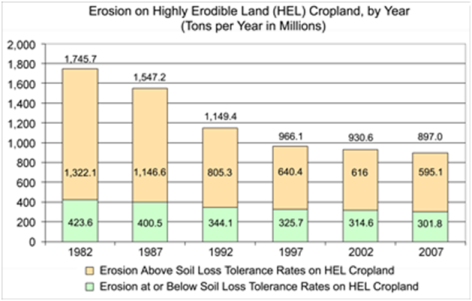
- The 1985 farm bill conservation provisions decreased average soil erosion by 40 percent nationally between 1982 and 1997, with 25 percent directly attributed to farmers implementing minimum conservation practices in exchange for generous subsidies. From 1982 to 2007, soil erosion on U.S. cropland dropped from 3.06 to 1.73 tons. The number of acres exceeding the “sustainable” rate of soil erosion decreased from 40 percent of cropland in 1982 to 28 percent in 2007.
- USDA found that “nonmarket benefits of erosion reduction due to compliance [accountability provisions] are estimated to exceed $1.4 billion per year” but since this study is over a decade old, the benefits are larger today.
- In 2011, CRP generated $3.5 billion in both market and nonmarket benefits, resulting in more than $2 of benefits for every taxpayer dollar invested. USDA projected that EQIP will return slightly over $1 back for every $1 of spending.
- As of 1997, the “eight percent reduction in cultivated cropland area attributed to CRP reduced aggregate wind and water erosion by an estimated 16 and seven percent annually.”
Wetlands Benefits
- The 1985 Swampbuster provision also helped the country realize a gain in wetlands from 1997 to 2007 for the first time in several decades. More specifically, it helped protect between 1.5 million and 3.3 million acres of vulnerable wetlands between 1982 and 1997, thus improving wildlife habitat and hunting and fishing opportunities.
- USDA estimates that WRP has consistently provided taxpayers with $2 back in both market and nonmarket benefits for every $1 of investment.
- Conservation programs and standards also provide public benefits like retaining soil moisture during dry years and preventing flooding in wet years.
A summary of conservation programs’ return on investment can be found in Table 1.
| Table 1: Annual Benefits and Costs of Conservation Programs | |||
| Conservation Program | Benefit | Cost | Benefit-Cost Ratio (with publication year of respective study) |
| Conservation Reserve Program | $3.5 billion | $1.6 billion | $2.19 (2011) |
| Environmental Quality Incentives Program | $2.09 billion | $2.08 billion | $1.01 (2009) |
| Wetlands Reserve Program | $406 million | $192 million | $2.11 (2009) |
| Note: each of these studies relied on projections so actual costs or benefits of the programs may have been slightly higher or lower, depending on funding allocations from Congress, market conditions, and other factors. Also, the benefit-cost ratio of various programs is not directly comparable since they were based on different timeframes and relied on different assumptions. | |||
Current Conditions
Progress toward reducing wetlands losses, soil erosion, and water pollution has leveled off, especially in areas with substantial row crop production. The graph below shows how efforts to reduce soil erosion on highly erodible land stalled after 1997. Since 2007, more land has come into crop production, primarily due to federal biofuels mandates and high crop prices. For instance, total acres planted to corn increased 16 percent between 2006 and 2013.
As the following map shows, soil erosion still exceeds the “sustainable” rate across the country but particularly in the Mississippi River Basin; excessive rates of erosion on highly erodible land are represented by red dots while green dots represent severe erosion on non-highly erodible acres. And since most conservation initiatives (like CRP and minimum conservation practices) were originally intended to simply reduce soil erosion without a deliberate goal of improving water quality, priorities should be revisited to ensure that programs are not working at cross purposes. For instance, no till practices may increase incentives to apply more herbicides and insecticides that eventually increase costs for downstream users.
.png)
Conclusion and Recommendations
Since 1985, conservation programs and practices have provided taxpayers with a positive return on investment. But better targeting, monitoring, and enforcement can save taxpayer dollars, further improve water and soil quality, reduce downstream costs, and limit future liabilities. Better targeting of conservation dollars in the late 1990s doubled public benefits and has shown promise with recent initiatives like the MRBI. And since more than three-fourths of cropland acres with medium to high potential for nitrogen runoff receive farm subsidies, a system is in place to ensure that taxpayers receive something back in exchange for generous support. In the future, we need a more cost-effective, accountable, transparent, and responsive agriculture safety net that minimizes unintended consequences, conserves land for the next generation, and provides taxpayers with a better return on investment.
For more information, visit www.taxpayer.net, or contact Joshua Sewell, josh at taxpayer.net.