Overview
For over 70 years American taxpayers have been doling out billions of dollars every year to underwrite the agriculture sectors’ cost of doing business. Established as “temporary” emergency measures during the Great Depression, these antiquated policies have since devolved into a gravy train supporting corporate agribusiness at the expense of the public purse. Only a handful of crops receive subsidies at all, and the majority of these subsidies flow only to corporate farms. And five types of crops, corn, wheat, rice, and soybeans receive the majority of all payments. Instead of supporting a struggling sector or promoting rural development these subsidies are only icing on the cake for the wealthiest and largest farmers.
Commodity Prices and Farm Income
2007 saw record crop prices and record farm income, according to USDA. Those records are expected to be surpassed in 2008, with crop value projected to be more than $201 billion – a 17 % increase over 2007.1 Net farm income is also projected to reach a new high in 2008 of $92.3 billion, 51 % above the 10-year average. The average farm household’s income is estimated to be $89,434 in 2008, according to USDA.2
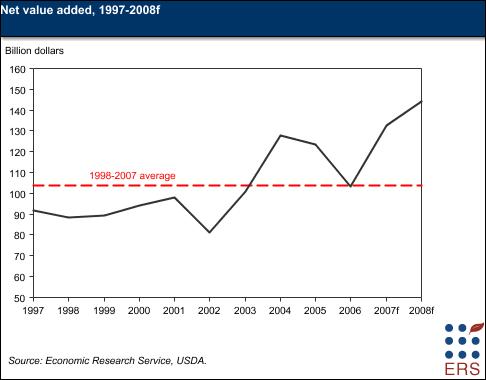
Many factors are contributing to the price increases being experienced by the commodity sector. These include the pressure for planting more corn generated by the ethanol mandates, which reduces the amount of land available for other crops, increased food demand from other countries, and crop losses due to flooding and drought here and abroad. But while record crop prices means that the amount of government handouts will be lower than in recent years, USDA still anticipates padding farmers’ pocket with an additional $13.4 billion3 in taxpayer funded payments in 2008.
Concentrating the Wealth
According to an a analysis of U.S. Department of Agriculture data on subsidy payments, for farm program years 2003 to 2005, almost $39 billion in farm subsidy payments have been paid out. Just 10 % of recipients receive 66% of the payments, according to the data.4 Overall, the analysis finds that the top 1% (measured by income) of recipients received 17 % of the subsidy benefits over the period.5 Payments are also concentrated among large producers. The top 1% of producers receives 17% of the subsidies. Their average benefit was $377,484 per person for the three program years. Meanwhile, 80% of producers get just 16% of all subsidies.
While high crop prices are expected to keep some subsidy payments from being necessary in the near future, direct payments will continue to go out regardless of crop price, production, or whether a crop is even harvested. These payments are estimated to cost more than $5 billion per year. And under the new 2008 farm bill, households making up to $1.5 million in farm income and up to $1 million in non-farm income are still eligible to receive subsidies.
Conclusion
The farm economy is prospering. With record crop prices, farm incomes are also setting records. Meanwhile, direct payments that have no relationship to production levels or crop prices will continue to go out at a rate of over $5 billion per year. Under such circumstances the farm subsidy system deserves much greater reform than occurred in the new 2008 farm bill.
For more information, contact Taxpayers for Common Sense at 202-546-8500.
(PDF Version of this document)
1.For USDA farm income data, see U.S. Department of Agriculture, Economic Research Service, “Farm Income and Costs,” at http://www.ers.usda.gov/briefing/farmincome/ (May 7, 2008), and “2008 Farm Income Forecast,” at http://www.ers.usda.gov/Features/FarmIncome/2007/November/ (May 7, 2008).
2. US. Department of Agriculture, Economic Research Service, “2008 Net Farm Income Is Forecast To Be $92.3 Billion.” Accessed 7/30/08.
3. USDA’s Farm Income and Costs: Farm Sector Income Forecast, available at http://www.ers.usda.gov/Briefing/FarmIncome/Data/GP_T6.htm
4. Environmental Working Group analysis of USDA data. http://farm.ewg.org/sites/farmbill2007/region1614.php?fips=00000. Accessed 7/29/08.
5. http://www.mulchblog.com/2007/06/full_disclosure_who_really_ben.php. Accessed 7/29/08.