Late Thursday afternoon (Nov. 18) the Congressional Budget Office (CBO) released a complete cost estimate of the economic and budgetary impacts for the latest version of the House reconciliation bill, H.R. 5376, the Build Back Better Act. As the official arbiter of the cost of legislation, CBO’s “score” of a bill is important for understanding the potential effects of proposed policies because these scores, added together, form the baseline from which budgets are built. This particular score takes on added importance because a bloc of Democrats had insisted on seeing a final score and that the bill was “paid for” before having a vote on passage. Insisting Congress, and the American public, have both final bill text and the CBO’s cost estimate for that text with adequate time to digest both before a vote is a common sense position Taxpayers for Common Sense supports. However, with the full CBO score released the evening of Nov. 18 and a final vote the morning of the 19th, little time was available to digest the full score. Regardless, here it is…
A summary can be found directly below, with a breakdown of revenue, spending, and deficits from CBO and the Joint Committee on Taxation here.
CBO Cost Estimate for the Build Back Better Act
Over ten years (FY2022-2031)
- Increase in spending = $1.636 trillion
- Increase in revenue = $1.268 trillion
- Total effect on deficit = $367 billion increase
CBO Cost Estimate Caveats
While both Democrats and Republicans are pointing to the CBO score to reinforce their support or opposition to the bill, the ultimate cost of H.R. 5376 will likely differ, potentially substantially, from the official score. This is because estimates are not predictions, and economic conditions may change. It is also because future Congresses will pass laws affecting taxes and spending. Finally, the bill itself only extends some policies, such as the Enhanced Child Tax Credit, temporarily meaning costs (or savings) are only estimated for those years. In reality, some of these popular provisions will be extended.
- More revenue MIGHT be generated, but is not scored
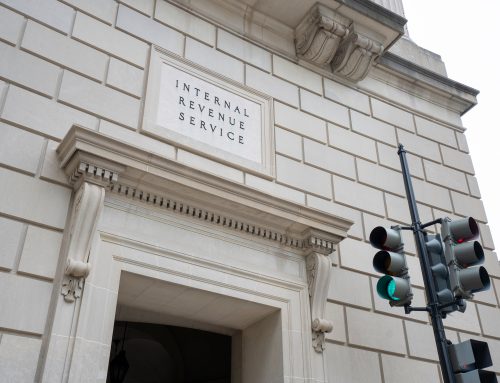
- The bill’s resources directed to the Internal Revenue Service (IRS) to close the tax gap (taxes owed but not paid) are not scored. The CBO does estimate this could generate $207.2 billion in revenue. The Treasury estimates closer to $450 billion.
- Spending takes 10 years so might not happen
- The $1.635 trillion in increased spending is doled out over 10 years. In fact, CBO estimates only about $117 billion in increased outlays this fiscal year while 56 percent of the funds will be spent before September 30, 2026. In fact, $42 billion would remain unspent even after 10 years.
- Revenue estimates are over 10 years so might not happen
- Like most bills passed by Congress, while spending is slightly weighted to the first few years, expected increases in revenue are claimed in the out-years. Over the next two years the bill’s tax cuts and credits would actually DECREASE revenue by a total of $54.7 billion. Revenue in the first five years would balance to nearly a $150 billion increase. But that leaves $1.12 trillion (88 percent) of revenue to pay for the bill needing to be generated from 2027 to 2031.
- The Senate has not yet spoken
- However you slice it, the version of H.R. 5376 the CBO analyzed is unlikely to be signed into law. The Senate is expected to make changes, perhaps substantial, so CBO will have another opportunity to score the Build Back Better Act.