Read the full report as a PDF.
U.S. agriculture subsidies were created in the 1930s during the Great Depression with an intent to prop up low crop prices and address massive soil losses from the Dust Bowl.
Since then, multiple agriculture subsidies have been layered on top of one another resulting in market and trade distortions and countless unintended consequences.
The Organization for Economic Co-operation and Development (OECD) estimated that agriculture subsidies represented nearly 10 percent of U.S. gross farm receipts from 2014-16.[i] In total, agriculture subsidies are expected to cost taxpayers approximately $15 billion each year over the next decade.[ii] One program alone – the highly subsidized federal crop insurance program – cost taxpayers $14 billion in 2012. Since most agriculture subsidy programs are tied to current market conditions and farm size, the larger the farm, the greater the subsidy paid by taxpayers.
These government interventions into the marketplace have large impacts on farm management decisions, including artificially propping up revenues, encouraging planting crops favored by Washington instead of the market, increasing risk taking at taxpayer expense, and less use of unsubsidized risk management tools. In turn, they create unintended consequences such as contributing to barriers for beginning farmers (by increasing land values), and creating long-term taxpayer liabilities when environmentally sensitive land is converted to subsidized crop production. Instead of primarily propping up incomes of wealthy landowners during both good and bad growing years, the government should instead minimize its role in agriculture and step in only when the market is not otherwise capable of managing systemic risks posed by major droughts and floods, for instance.
Descriptions of Current Farm Subsidy Programs
The most recent farm bill – enacted in 2014 – amended farm subsidy programs. The bill eliminated direct payments, a program that paid producers a subsidy regardless of current market conditions or crop prices. While direct payments were one of the least trade-distorting programs, they still increased farmers’ incomes (primarily the largest farms) and distorted land values. The 2014 farm bill replaced direct payments with several new “shallow loss” subsidy programs that subsidize small dips in producers’ income. Many of the other subsidy programs enacted prior to 2014 remain in effect today. Descriptions of major current subsidy programs and their impacts on farm management decisions can be found below.
Categories of Ag Subsidy Trade Distortions
– Green box: minimally or non-trade distorting, such as land conservation payments.
– Blue box: production-limiting subsidies; U.S. does not currently have any payments in this category.
– Amber box: most trade distorting; certain level of subsidies under this category are allowed each year (where most U.S. agriculture subsidies are categorized), but subsidies are still subject to trade disputes with other countries; crop insurance, LDPs, marketing loans, shallow loss, dairy, sugar, and price supports all fall within the amber box category.
– Red box: prohibited by the WTO since they are too trade-distorting.
- The highly subsidized crop insurance program operates largely as an income guarantee program for over 120 crops. The majority of subsidies go to producers of the “big five” crops – corn, soybeans, wheat, cotton, and rice. Rather than solely protect against significant crop losses from droughts or floods, most crop insurance policies guarantee an expected level of annual revenue. Premiums charged for this insurance are highly subsidized with taxpayers, on average, covering 62 percent of a farmer’s premium cost. Because crop insurance subsidies increase with the size of the farm (the more acres, the larger the subsidy), and are tied to a specific crop, they are often considered to be trade distorting.[iii] It is also highly lucrative for the agricultural sector. Over the last 10 years, agricultural businesses have received $2.21 in crop insurance indemnity payments for every $1 they paid in premiums.
- Price supports (currently known as Price Loss Coverage – PLC – subsidies) are government-set prices that have been on the books in various forms for decades. If the price of a subsidized crop falls below the “reference” price set by Congress, eligible producers receive a subsidy check. PLC payments increase the liquidity of producers, influence farm labor decisions, alter land values, and reduce income variability. Price supports are considered to be trade distorting since they are tied to crop prices.[iv]
- New income guarantee subsidies, or shallow-loss programs, have added another layer to the expanding subsidy sandwich. They ensure that producers receive a government check if crop revenue (prices times yield) falls as little as five or ten percent below a pre-determined level. Agriculture Risk Coverage (ARC), the largest shallow loss program enacted in 2014, specifically guarantees a band of revenue between 76 and 86 percent, meaning that just a 14 percent dip from recent income levels would trigger a taxpayer-subsidized payout. ARC is subsidized by taxpayers at a rate of 100 percent. The WTO generally considers revenue guarantees greater than 70 percent to be trade distorting.[v] ARC, in addition to two other new shallow loss programs in the 2014 farm bill – Supplemental Coverage Option (SCO) and Stacked Income Protection Plan (STAX) – are hence trade distorting, given that they influence producers’ planting decisions.[vi]
- Marketing loans and loan deficiency payments (LDPs) are additional payments that allow farmers to receive government subsidies during times of lower market prices. They increase crop revenue, reduce income variability, allow agribusinesses to expand farm acreage at taxpayer expense, and increase the price of farmland.
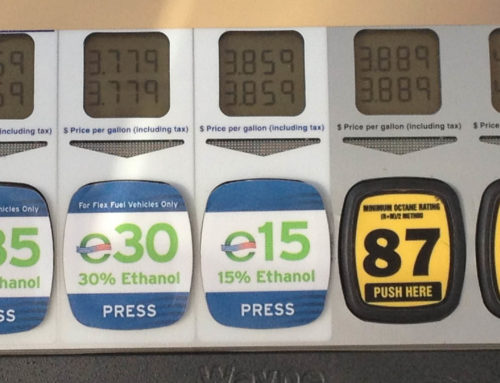
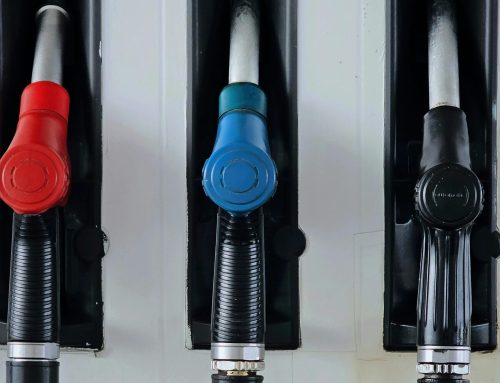
- Others: A myriad of other agriculture subsidies prop up specific industries, such as sugar and dairy supports, and biofuels subsidies/mandates, the latter which primarily benefit the corn and soybean industries. These policies encourage the planting of certain subsidized crops over others, picking winners and losers. As a result of government interventions into the marketplace, average prices that dairy and sugar producers received from 2014-16 were three percent higher than those in other countries.[vii] While the sugar lobby claims its industry supports are not direct subsidies, they have exceeded limitations on U.S. subsidies for trade purposes as recently as 2011.[viii] Inflexible biofuels mandates have historically remained in place even during years of historic drought (2012), pushing crop prices to record levels and affecting producers’ planting decisions.
Impact of Agricultural Subsidies on Risk Taking
Anytime billions of dollars in government subsidies are distributed each year, producers’ management decisions will be affected and resources will be distributed ineffectively. Researchers have documented the following impacts and unintended consequences of agricultural subsidies:
- Reducing the cost of doing business, with effects on planting decisions: For example, crop insurance “subsidies raise the net revenue per acre and thereby raise incentives to plant eligible crops and plant more of crops with higher subsidy rates.”[ix] With producers planting for Washington instead of the market, planting decisions are distorted since not all crops – especially fruits and vegetables – are as heavily subsidized or subsidized at all.
- Less use of unsubsidized risk management tools: With taxpayers footing the bill for additional risk taking, producers are less likely to use other risk management techniques such as diversification, vertical integration, and crop rotations. Numerous studies have found that the receipt of crop insurance subsidies resulted in increased farm specialization and less diversification.[x]
- Increasing risk taking at taxpayer expense: Shifting normal costs of doing business onto taxpayers’ backs increases risk taking. Crop insurance subsidies affect farmers’ business decisions by promoting riskier planting decisions, such as planting crops on poor farmland.[xi] Through base acres (see below for a description), price supports are also tied to planting distortions and growing a certain crop for which the producer has base acreage, even if conditions make it riskier to do so.[xii]
- Increased consolidation: When large farmers become wealthier – by receiving more subsidies the more acres they farm – they are able to bid up land prices, acquire more land at taxpayer expense, and put beginning and smaller farmers at a disadvantage. Researchers estimate that farmland values have increased 15-25 percent due to farm subsidy payments.[xiii]
- More use of chemical inputs: More inputs such as herbicides and pesticides are used when taxpayers are subsidizing producers’ incomes. For instance, researchers found that cotton acreage – an input-intensive crop – is higher due to the receipt of cotton subsidies.[xiv] And more generally, crop insurance subsidies’ effects on production decisions results in farmers switching from unsubsidized crops requiring lower inputs – such as alfalfa, hay, and pasture – to other input-intensive crops like corn. Overall chemical use increases as a result.[xv]
A Farmer’s View
“Agricultural subsidies have been capitalized into the price of farmland… thereby increasing a farmer’s land cost. It is essentially a zero net return to the agricultural producer as any financial benefit from subsidies evaporate with the increased cost of land… If you already own a farm why do you need welfare subsidies?”
– Mark Caspers, Nebraska farmer
Case in Point: Peanut Subsidies
Federal peanut subsidies are just one of numerous examples of governmental programs influencing planting decisions, and producing waste and market distortions. Federal commodity program payments under ARC and PLC are tied to the “base acres” each farmer holds with the U.S. Department of Agriculture (USDA). Payments are de-coupled from annual plantings, meaning a producer with “corn base acres” can grow soybeans or other commodities on that acreage, but payments would be based on corn prices. According to CBO, peanut base acres currently exceed the actual number of acres planted to peanuts by hundreds of thousands of acres.[xvi] In other words, taxpayers are subsidizing crops that are not even planted. Peanuts also disproportionately benefit from quirks created when the 2014 farm bill, in an attempt to resolve a WTO dispute with Brazil, removed cotton as an eligible commodity and converted cotton base to “generic base.” Producers can plant any eligible commodity on generic base and potential payments under ARC/PLC are then tied to prices (coupled) for that planted commodity. Peanuts receive more generic base acre subsidies than any other crop[xvii], and per-acre peanut generic base acre subsidies are nearly 13 times higher than those for wheat, for instance ($288.77 vs. $23.22 per acre).[xviii] In fact, peanuts are expected to account for nearly a third of generic base payments over the next decade[xix] even though they are planted on less than one percent of U.S. cropland.[xx] Much of this can be explained by the fact the peanut reference price set by the 2014 farm bill ($535 per ton) has exceeded actual market prices each year for the last four years and market prices are not expected to rise above the reference price any year in the next decade. The University of Illinois notes that these discrepancies may cause planting and market distortions.[xxi] Hence, peanut stocks are expected to exceed demand by a ratio of 30-50 percent when producers overplant.[xxii] Taxpayers are left footing the bill.
Unintended Consequences of Farm Subsidies
As detailed above, receiving farm subsidies incentivizes producers to modify their farm management decisions. As a result, many unintended consequences can result from market and planting distortions. Below we dive deeper into a few of the most costly unintended consequences of agricultural subsidies’ effects on farm management decisions, including pushing production of crops onto risky and sensitive land at taxpayer expense. Market and planting distortions also results in more taxpayer liabilities such as water pollution and public health costs, not to mention challenges for beginning farmers as they attempt to compete with producers receiving millions of dollars in federal subsidies.
A Farmer’s View
“Government subsidies do not help young, beginning farmers and, consequently, do not help rural America!”
– Scott Kinkaid, Nebraska farmer
Promotion of Risky Planting Decisions
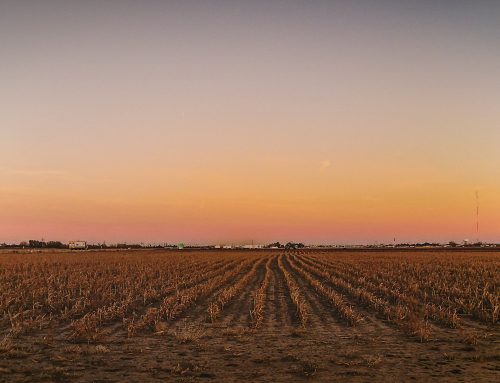
Multiple researchers have documented the loss of millions of acres of native grasslands and wetlands due to increased agriculture subsidies. Economists Daniel Sumner and Carl Zulauf found that “subsidized crop insurance encourages the movement of crop production onto marginal lands and can result in environmental risks that would not occur in the absence of subsidized crop insurance.”[xxiii] In fact, crop insurance subsidies have increased the rate at which wetlands were drained and converted to crop production,[xxiv] not to mention acres of cropland increasing in areas prone to crop losses such as western KS and OK, SD, and northern TX.[xxv]
The negative impacts are not tied to crop insurance subsidies alone, however. USDA’s Economic Research Service (ERS) also found that marketing loan benefits and disaster subsidies “encourage farmers to cultivate more land than they otherwise would, partly at the expense of rangeland [and grasslands]… [these programs] may result in unintended, environmentally damaging actions” and work at cross-purposes with other federal programs designed to conserving sensitive land such as native grasslands, wetlands, etc.[xxvi] In particular, ERS estimates that “hay and pasture acreage would have been roughly 5 percent larger during 1997-2007” if subsidy programs had not reduced risk and made it economical for farmers to plant crops on these sensitive acres.[xxvii] Biofuels subsidies and mandates have also been tied to the loss of millions of acres of grasslands and wetlands, resulting in more – instead of less – greenhouse gas (GHG) emissions when producers choose to plant resource-intensive annual crops such as corn and soybeans on acres that would have otherwise remained in pasture, grasslands, or wetlands.[xxviii]
Impact on Erosion and Water Pollution
When producers are more likely to plant crops on marginal, risky land with taxpayers footing part of the bill, effects on wind and water erosion, water quality, and other environmental indicators are seen downstream. The National Academies of Science concluded that crop
insurance premium subsidies are higher for riskier crops and land with highly erodible soils.[xxix] USDA-ERS estimated that in just one year – 1997 – higher crop insurance subsidies encouraged producers to plow up 2.5 million acres of hay, pasture, and other land, resulting in increased wind and water erosion.[xxx] Crop insurance subsidies also increase “cultivation in areas subject to greater potential nutrient losses to water.”[xxxi] Similarly, government-set target prices are tied to increased nitrogen fertilizer use by up to 15 percent (even if production does not jump by a commensurate amount), increasing the likelihood that fertilizer and chemicals run into nearby waterways and pollute local and downstream water supplies. Not only are communities left footing the bill with higher water bills due to the increased water treatment cost of removing high levels of nitrates from drinking water, but taxpayers also lose when other federal programs are later created to clean up the mess that agriculture subsidies had a part in causing.
Conclusion and Recommendations
Now more than ever, Congress should reduce its role in the everyday business decisions of agricultural producers. The federal footprint in agriculture could be reduced by enacting a more cost-effective, transparent safety net responsive to current needs and in which all parties are held accountable for achieving results. Allowing producers to plant for the market instead of Washington would not only increase producers’ long-term financial stability but would also improve their ability to respond to changes in market conditions without taxpayer intervention. Market- and trade-distorting subsidies that influence planting decisions and contribute to numerous unintended consequences should be eliminated once and for all. Instead of propping up producers’ income each year regardless of crop or market conditions, taxpayer support should instead only kick in after major disasters such as floods or droughts. That way, Washington can step aside and allow producers to better utilize the array of unsubsidized risk management tools already at their fingertips.
Footnotes
For more information, visit www.taxpayer.net, or contact Joshua Sewell at josh at taxpayer.net.
[i] http://www.oecd.org/tad/agricultural-policies/producerandconsumersupportestimatesdatabase.htm
[ii] https://www.cbo.gov/sites/default/files/recurringdata/51317-2017-01-usda.pdf
[iii] https://www.ers.usda.gov/topics/farm-economy/farm-commodity-policy/us-domestic-agricultural-support-in-the-international-context/
[iv] https://fas.org/sgp/crs/misc/RS20840.pdf
[v] https://fas.org/sgp/crs/misc/RS20840.pdf
[vi] https://fas.org/sgp/crs/misc/RS20840.pdf
[vii] http://www.oecd.org/tad/agricultural-policies/producerandconsumersupportestimatesdatabase.htm
[viii] https://fas.org/sgp/crs/misc/RS20840.pdf
[ix] https://ageconsearch.tind.io/record/156622/files/Sumner-Zulauf_Final.pdf
[x] https://www.nap.edu/read/12832/chapter/9#294, https://www.fginsight.com/news/report-finds-crop-insurance-is-bad-for-environment-and-taxpayers-24293
[xi] http://ageconsearch.umn.edu/bitstream/205777/2/AAEA%202015%20subsidized%20crop%20insurance_Jisang_Yu_July.pdf
[xii] http://www.choicesmagazine.org/2005-3/grabbag/2005-3-05.htm
[xiii] https://books.google.com/books?id=Tw0HDAAAQBAJ&pg=PA92&lpg=PA92&dq=15+to+25+percent+due+to+farm+subsidy+payments+farmland+values&source=bl&ots=8Igl4wf76t&sig=VoEycwwWhqJUdP05JtmH19hQTvo&hl=en&sa=X&ved=0ahUKEwjJ2_GrjoLWAhWijlQKHStjBlkQ6AEIKDAA#v=onepage&q=15%20to%2025%20percent%20due%20to%20farm%20subsidy%20payments%20farmland%20values&f=false
[xiv] https://ageconsearch.tind.io/record/156622/files/Sumner-Zulauf_Final.pdf
[xv] https://www.nap.edu/read/12832/chapter/9#294
[xvi] https://www.cbo.gov/sites/default/files/recurringdata/51317-2017-01-usda.pdf
[xvii] http://farmdocdaily.illinois.edu/2017/04/beneath-the-label-a-look-at-generic-base-acres.html
[xviii] http://farmdocdaily.illinois.edu/2017/04/beneath-the-label-a-look-at-generic-base-acres.html
[xix] https://www.cbo.gov/sites/default/files/recurringdata/51317-2017-01-usda.pdf
[xx] http://usda.mannlib.cornell.edu/usda/current/Acre/Acre-06-30-2017.pdf
[xxi] http://farmdocdaily.illinois.edu/2017/04/beneath-the-label-a-look-at-generic-base-acres.html
[xxii] https://www.cbo.gov/sites/default/files/recurringdata/51317-2017-01-usda.pdf
[xxiii] http://static.ewg.org/pdf/Sumner-Zulauf_Final.pdf?_ga=2.161337912.443264076.1504105034-1373537909.1481568681
[xxiv] https://www.ers.usda.gov/webdocs/publications/45609/17593_err25_1_.pdf?v=41056
[xxv] https://www.ers.usda.gov/webdocs/publications/45609/17593_err25_1_.pdf?v=41056
[xxvi] https://www.ers.usda.gov/amber-waves/2011/september/native-grassland/
[xxvii] https://www.ers.usda.gov/amber-waves/2011/september/native-grassland/
[xxviii] http://iopscience.iop.org/article/10.1088/1748-9326/10/4/044003/meta
[xxix] https://www.nap.edu/read/12832/chapter/9#294
[xxx] https://www.ers.usda.gov/webdocs/publications/45609/17581_err25_reportsummary_1_.pdf?v=41056
[xxxi] https://www.ers.usda.gov/webdocs/publications/45609/17593_err25_1_.pdf?v=41056